In each edition of The Marketing Snapshot, we look at the data featured in our monthly Legal Marketing Index® (LMI). This month, we’re featuring data about Roundup litigation marketing. Here’s a snapshot of data from our October LMI. We’ll review demographic targeting and analysis, as well as media analytics. We’ve recently added digital and medical record data to our LMI, which we’ve included here.
Each month, our team systematically and objectively maps, measures, and analyzes legal data about media spending and our own proprietary response metrics to provide law firms with comprehensive, real-time data. Making smart use of the data, such as the information below, can significantly increase the probability of your marketing success.
With Roundup, as well as any other type of case you’re pursuing, the key is understanding your target audience. As an agency, we subscribe to tools that allow us to get a surprisingly granular level of demographic targeting. If you call us and say you’re interested in Roundup cases, other mass torts, or local market single event cases, we can quickly go in and profile the likely injured parties.
We look at the likely consumer behaviors, build a target group, and see how they index. This allows us to know where we’re going to have the highest odds of reaching this target audience and a great place to start before we have response data.
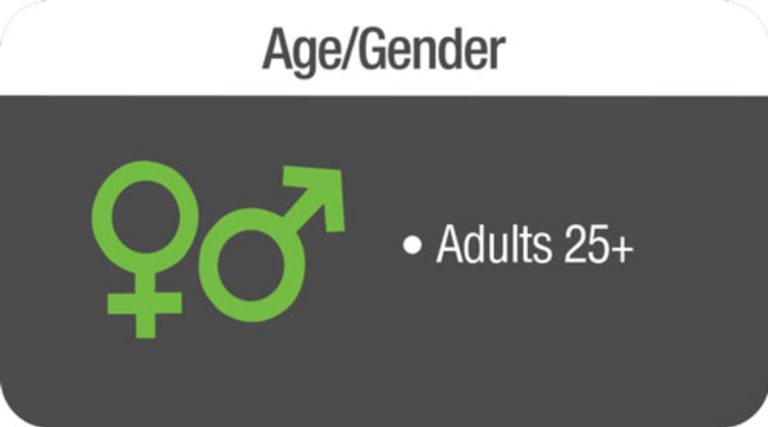
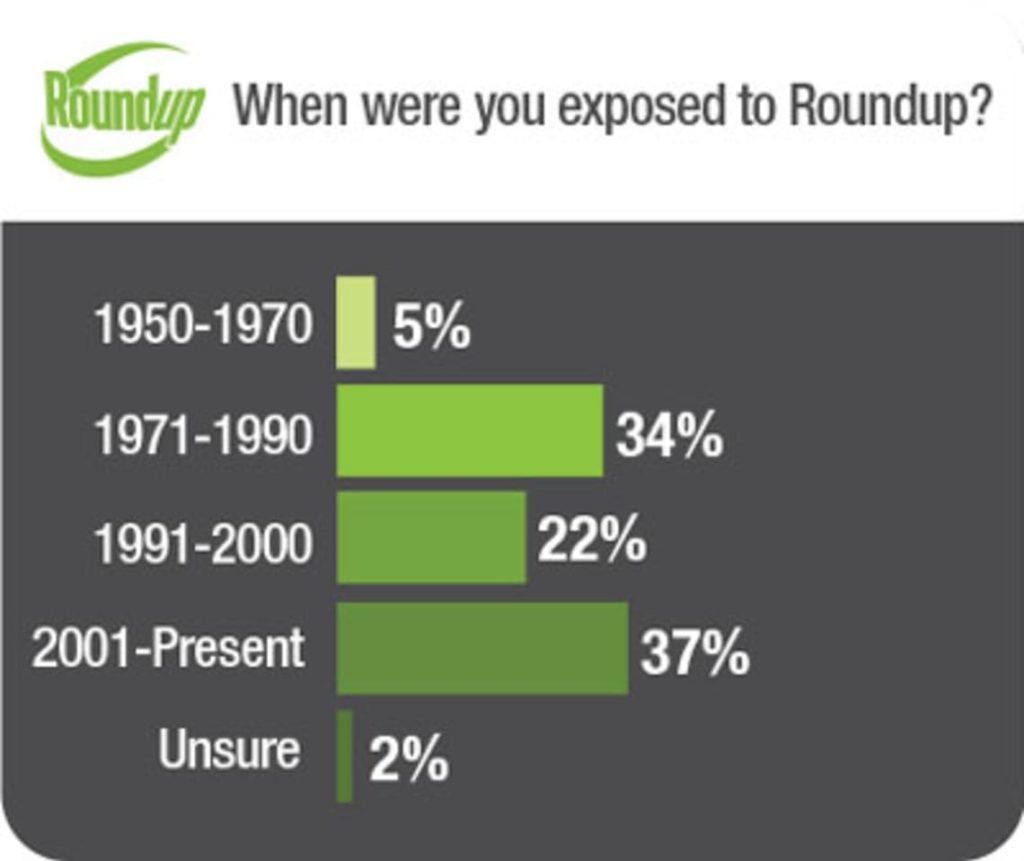
In our initial demographic targeting, we focused on Adults, 25+ who take care of their lawn, have purchased lawn/gardening items, and had cancer/oncology medical services. We were able to pinpoint which markets index high, as well as the type of media consumption.
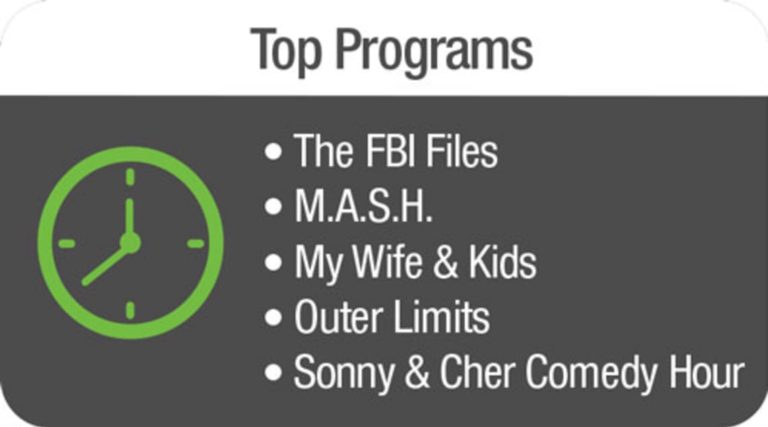
After a few weeks running ads, we can see which stations, time of day, and dayparts performed best, which impacts the schedule. Then, we use performance metrics to adjust and optimize media buying approaches.
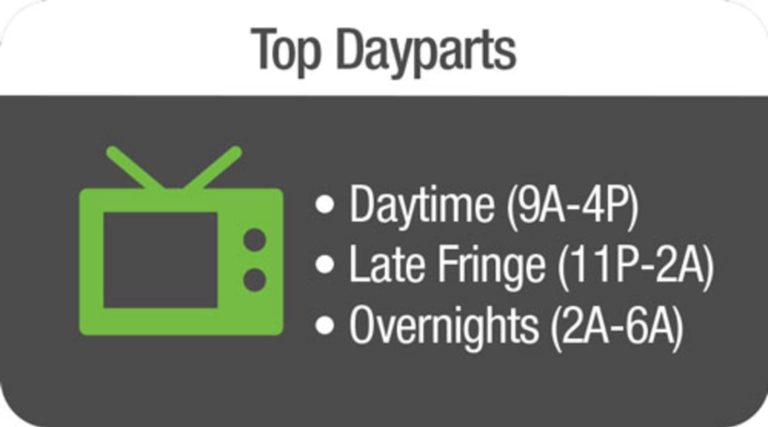
The demographic analysis shows us that responses came primarily from adults, aged 25 and above. The top dayparts included daytime (9am-4pm), late fringe (11pm-2am), and overnights (2am-6am). Knowing that two of the top dayparts are after business hours indicates if you were to run a Roundup campaign effectively, you would need after hours phone coverage to ensure your office responds immediately to incoming calls.
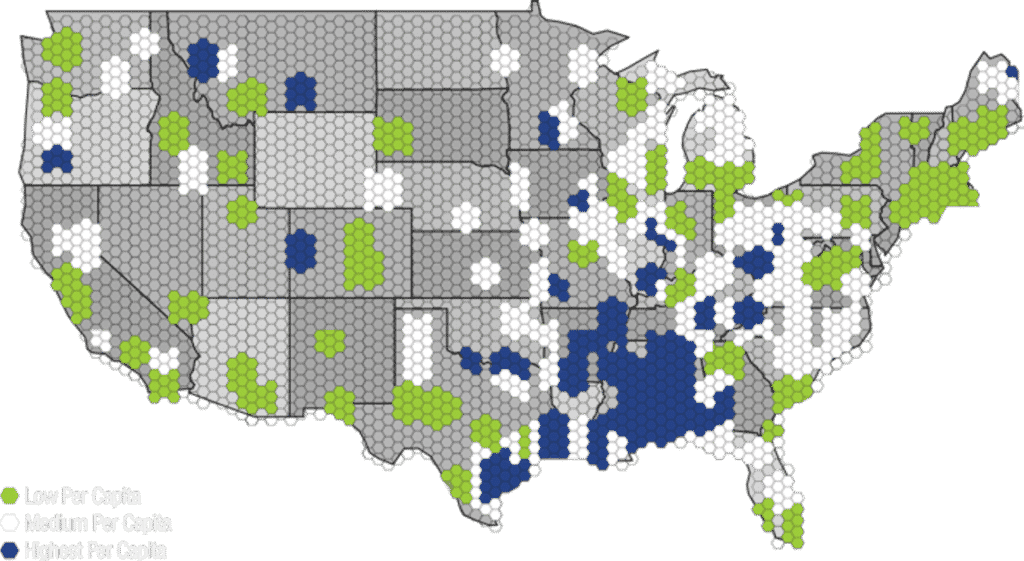
Because we run national campaigns, we get calls from all over the country. The Heat Map looks at calls that come in when the entire country has seen the ads. We track the responses and consolidate the data in a heat map, which shows the highest and lowest concentration of calls per capita. The per capita classification is based on call volume and population throughout the U.S. Top DMAs (designated market areas) for Roundup are also listed below.
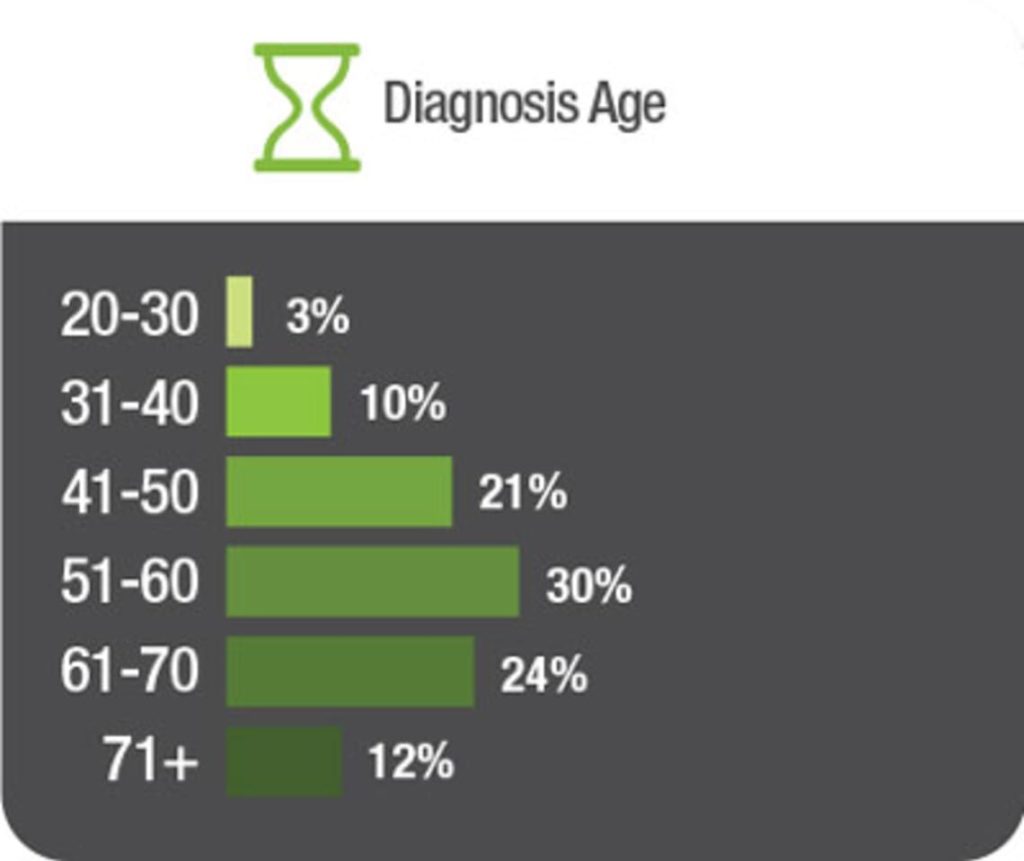
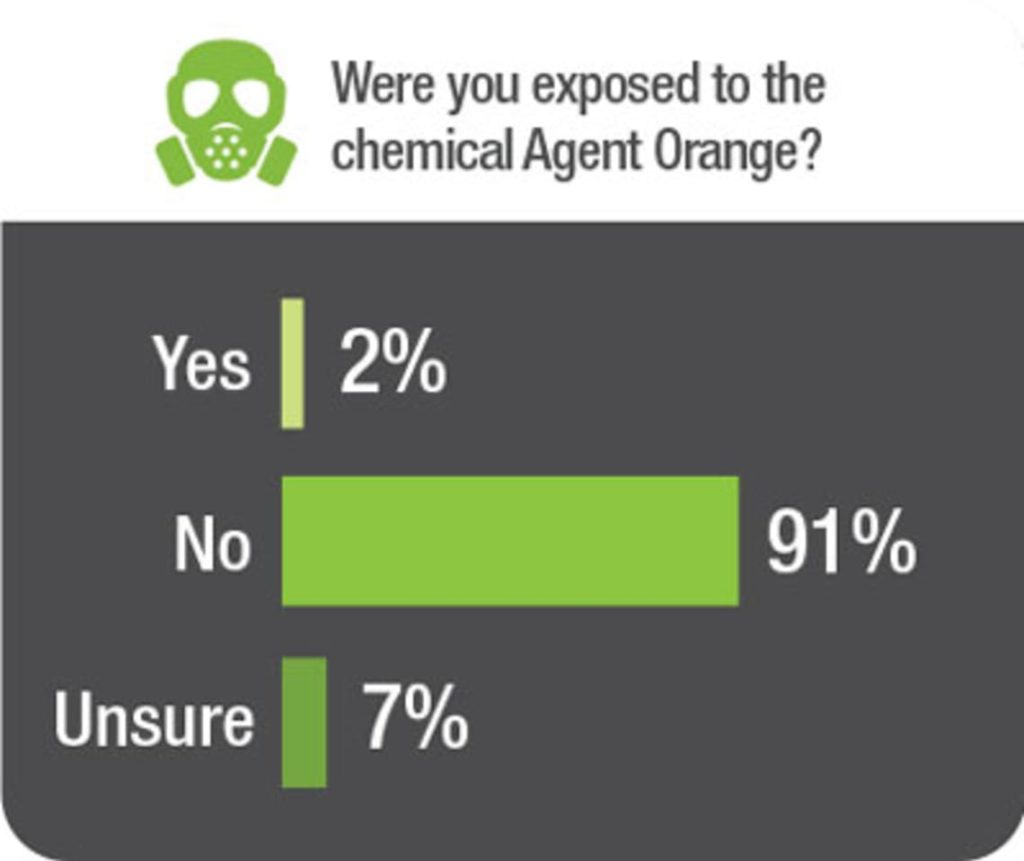
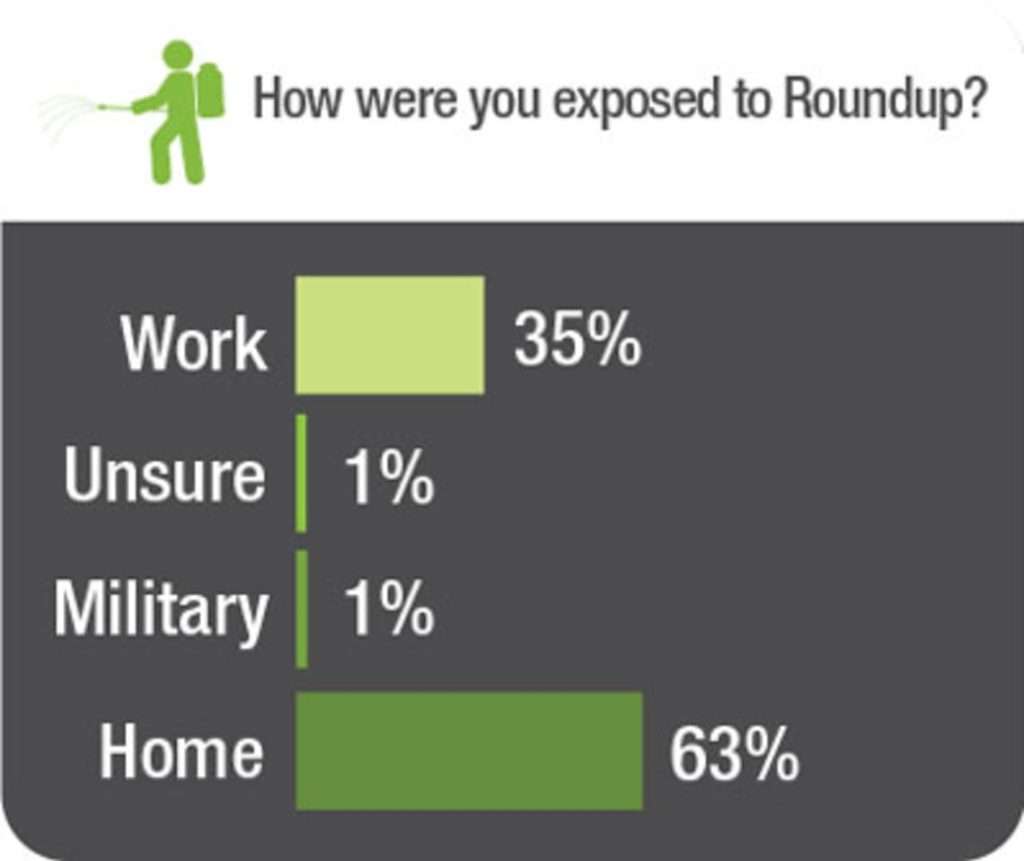
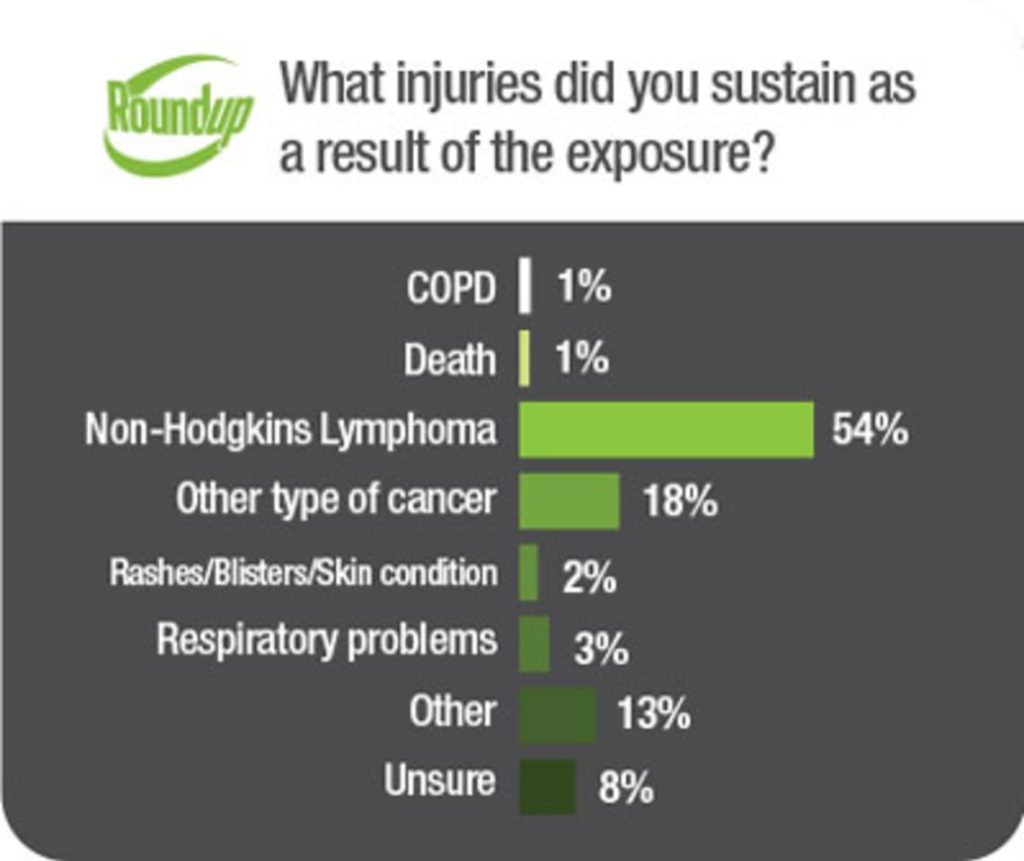
Our Consumer Attorney Telemarketing Services (CATS) provides us with data that we analyze to provide an insight into intake. The age breakdown of most common response calls was 51-60 (30%), 61-70 (24%), and 41-50 (21%). Additional information deals with qualifying questions about exposure and injuries.
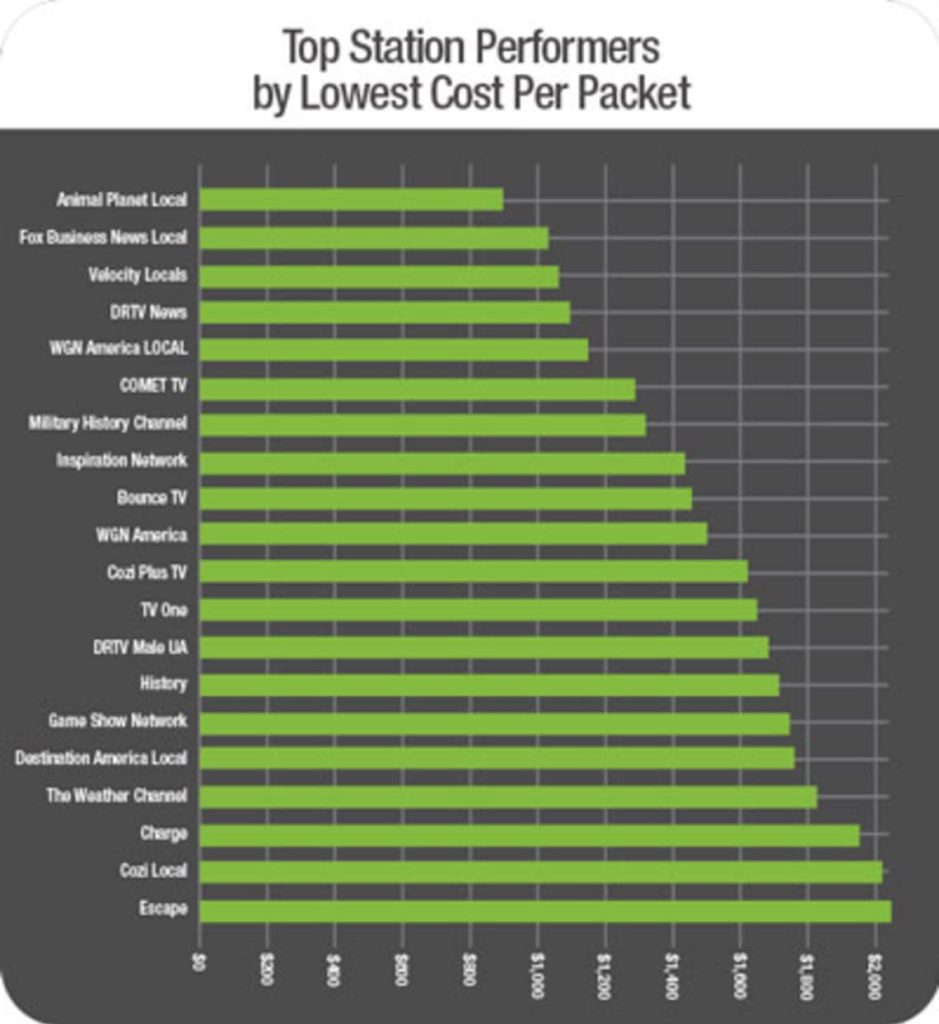
Based on our proprietary response data, we evaluate the top station performers by lowest cost per packet. This figure is dependent on the media costs divided by number of packets attributed to the channel. This data is pulled from qualified leads, callers, and packets that went out.
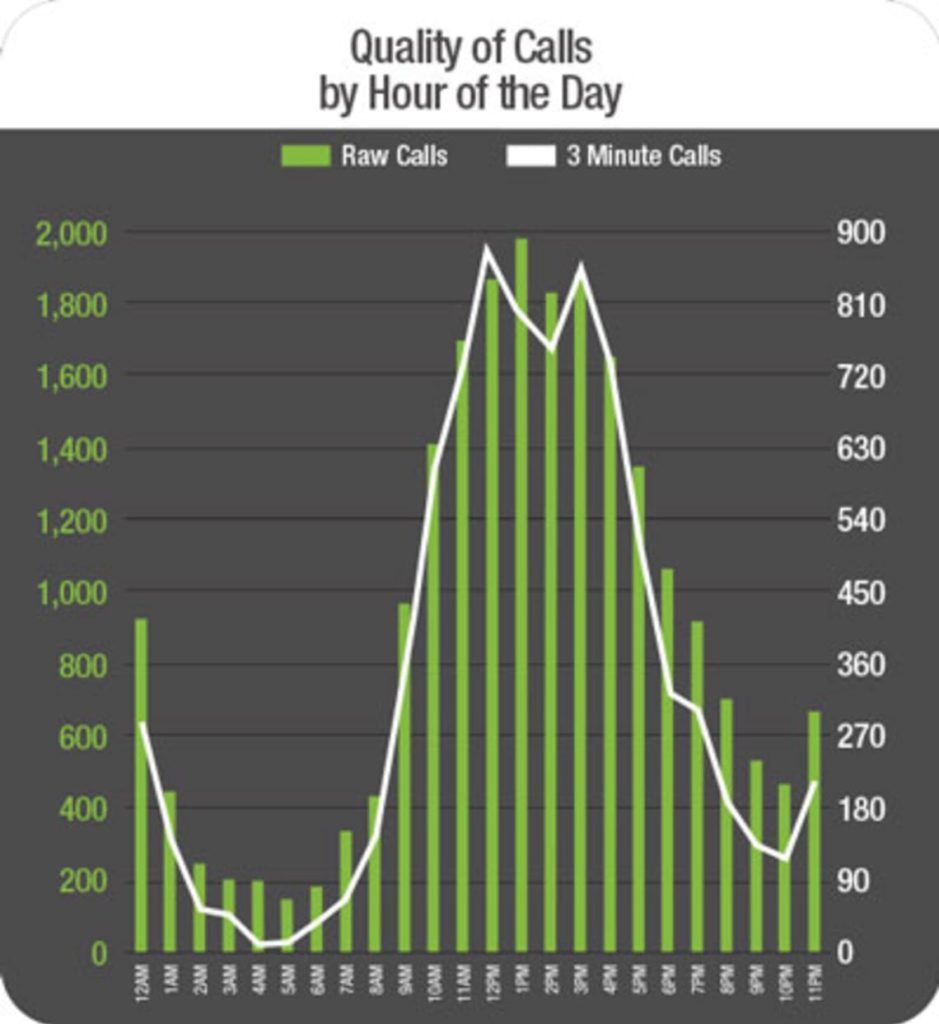
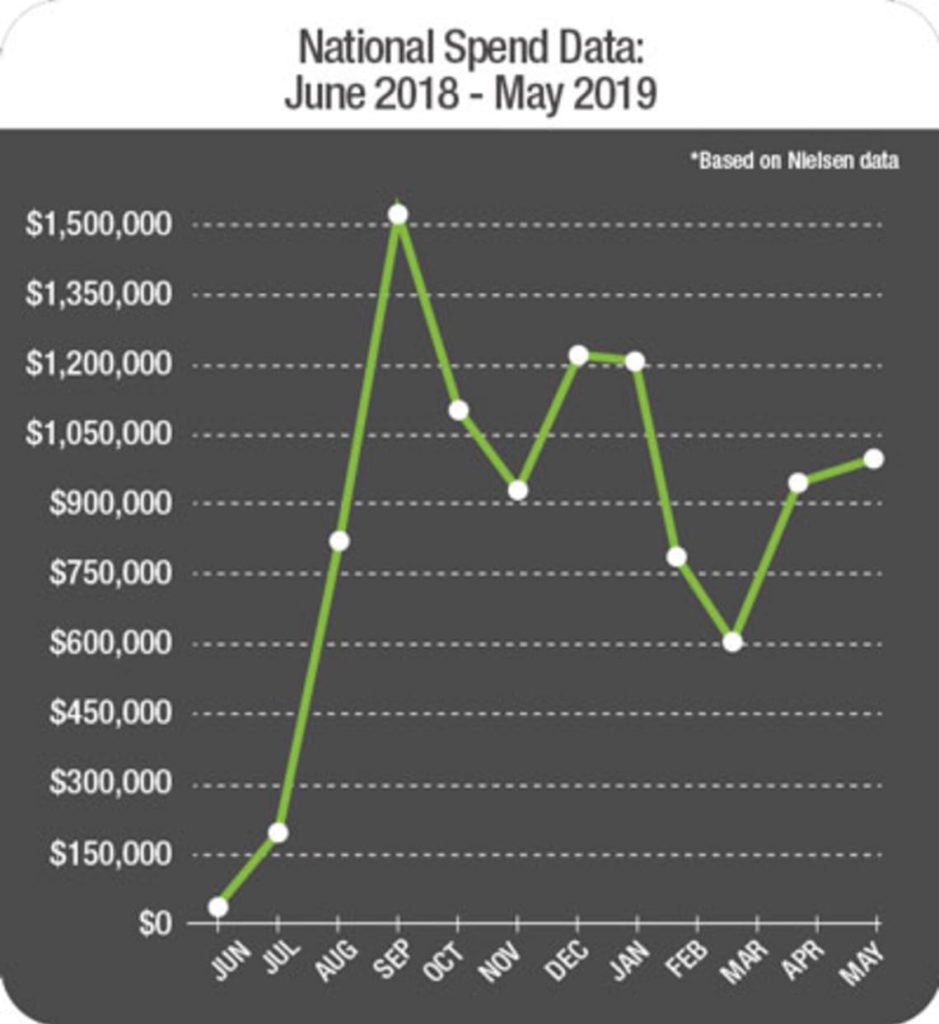
The Quality of Call data broken down by hours of the day shows peaks in both raw and 3-minute calls between noon and mid-afternoon. The LMI data also includes Nielsen national spend data from August 2018 through July 2019.
The information provided during initial intake questionnaires may be inconclusive or inaccurate. Callers may not remember or know specific information such as a device type or dates of medical services. Because we have a medical records company in Pensacola, Florida, we’re able to verify intake information to prequalify cases. According to the October LMI, 80% of the pre-qualified leads were verified for a non-Hodgkin lymphoma diagnosis. The fallout was 20% because there was no diagnosis or non-Hodgkin lymphoma or other cancers or the diagnosis could not be verified.
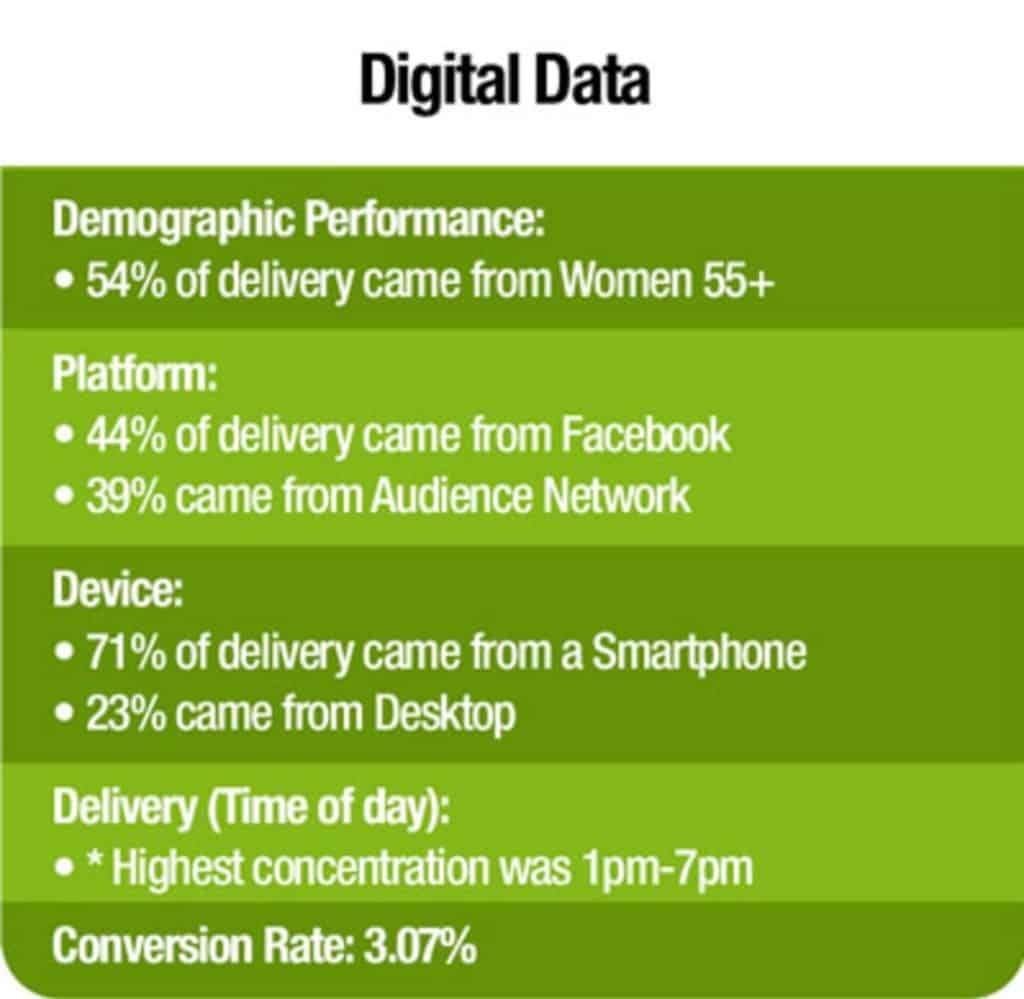
In our evaluation of our digital Roundup campaigns, we concluded that 54% of demographic performance came from women, 55+. The platform evaluation showed that 44% of digital response came from Facebook and 39% from Audience Network, tools generated by Facebook for external digital ad placement.
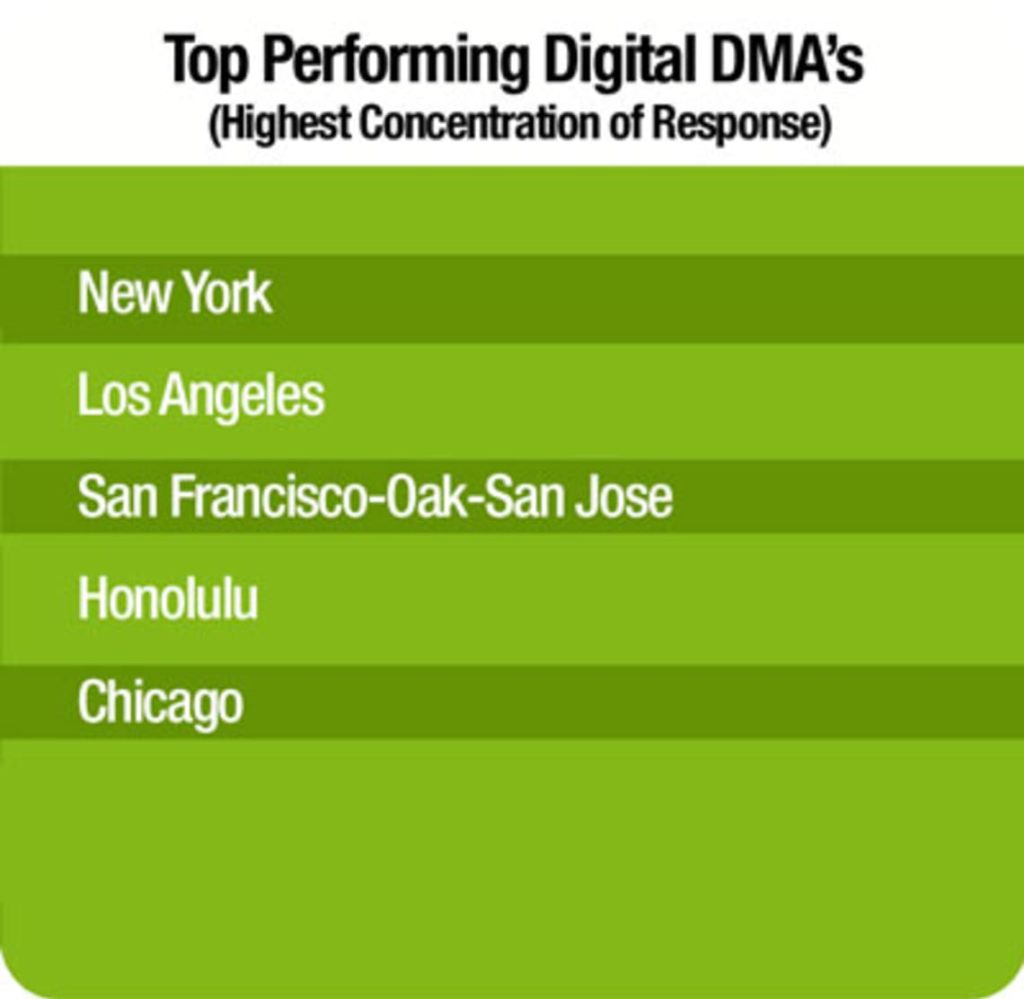
In terms of device delivery, 71% of delivery was via smartphone, compared to 23% from desktop. The highest concentration of delivery was between 1pm-7pm. The DMAs with the highest concentration of responses were New York, Los Angeles, San Francisco-Oakland-San Jose, Honolulu, and Chicago.
CAMG created the Legal Marketing Index® to provide the legal industry with relevant, comprehensive data that can be used to make smart, data-driven marketing decisions. Whether you’re investigating or running a mass tort campaign like Roundup or want information on single event marketing, the monthly LMI® is a valuable tool that can help you increase your probability of success.
5041 Bayou Boulevard #301
Pensacola, FL 32503
© 2024 Consumer Attorney Marketing Group • All rights reserved. | Privacy Policy | Terms of Use