Access The Latest Legal Marketing Index
CAMG’s Legal Marketing Index® offers unprecedented reporting and comprehensive analysis of real-time data. Because more intelligent marketing decisions mean a better ROI.
Please fill out this form to receive the latest Legal Marketing Index® each month!
* These fields are required.
Past LMI’s
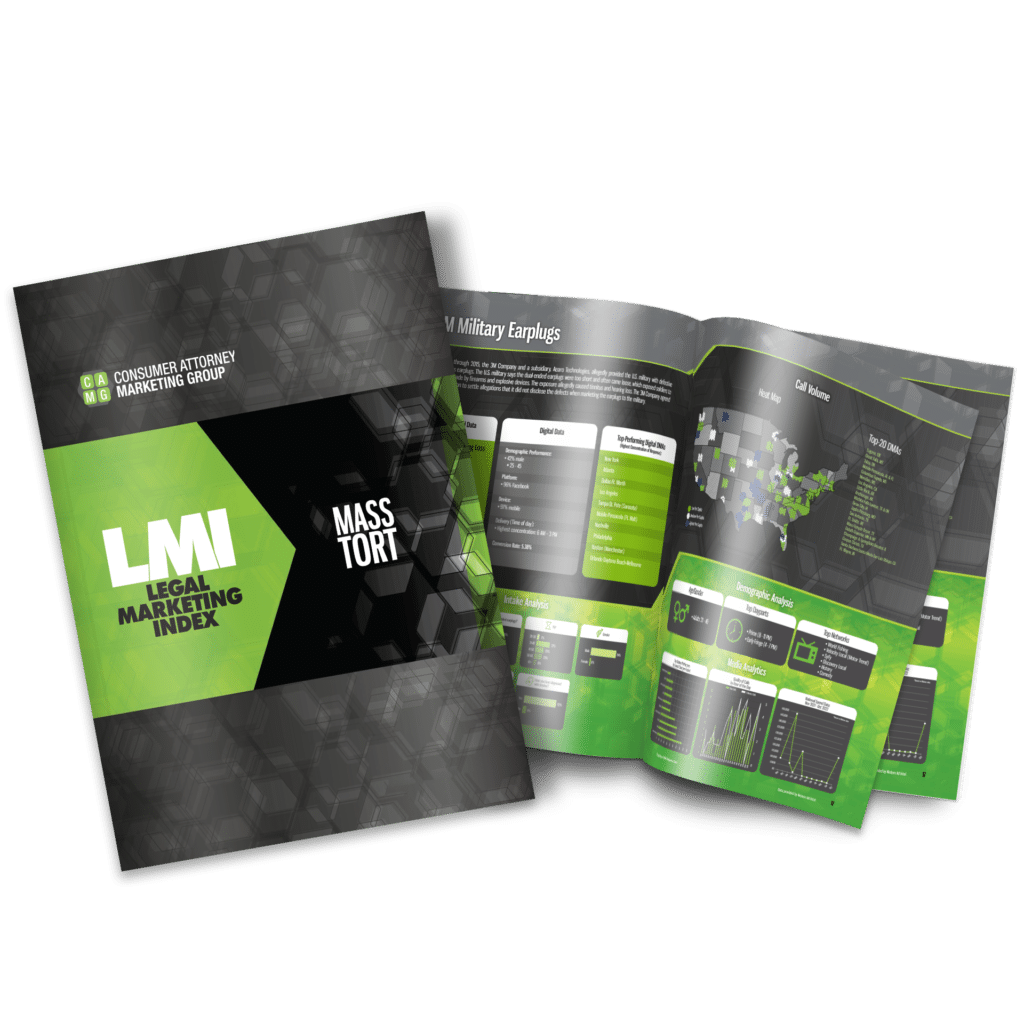
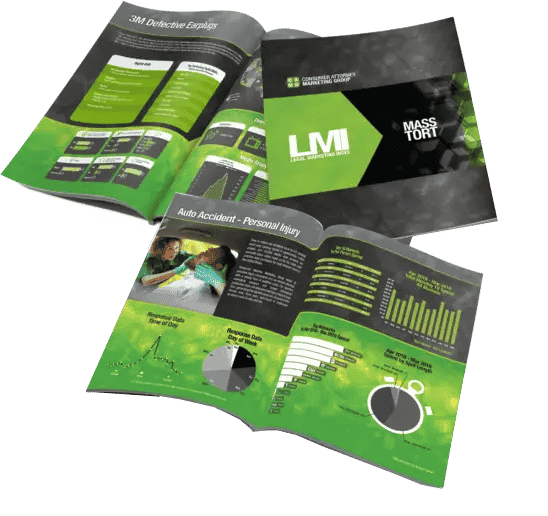
Mass Tort
March 2023 Mass Tort
February 2023 Mass Tort
January 2023 Mass Tort
December 2022 Mass Tort
October 2022 Mass Tort
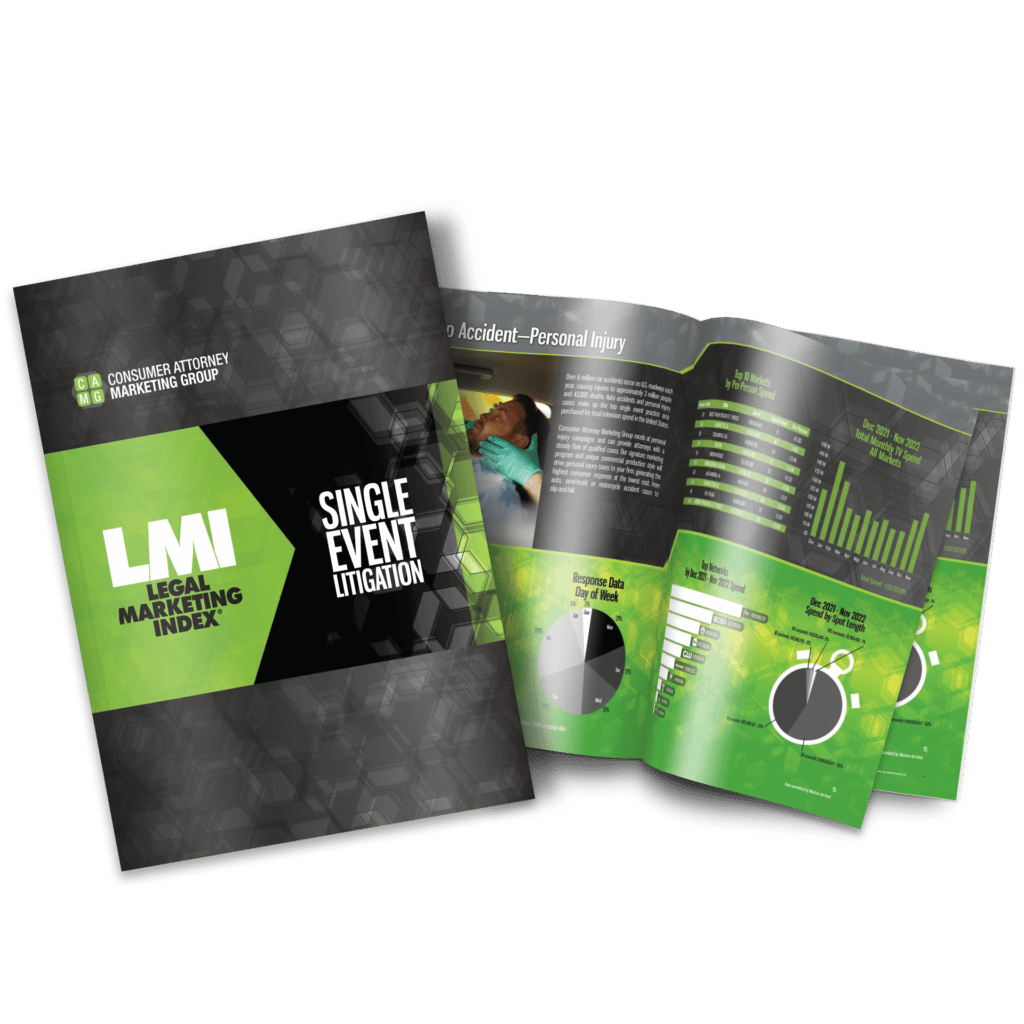
Single Event
March 2023 Single Event
February 2023 Single Event
January 2023 Single Event
December 2022 Single Event
November 2022 Single Event
October 2022 Single Event
Make Smart, Data-Driven Decisions
We created our Legal Marketing Index (LMI)® to provide the legal industry with unprecedented, unparalleled reporting and analysis of comprehensive, real-time marketing data. Making smart use of the LMI can significantly increase your efficiency of marketing.
Each month, our team systematically maps, measures, and analyzes pertinent media spending data for use in segmentation, targeting, and measurement.
Mass Tort LMI: Data & Analysis You Need to Run an Efficient Campaign
Our monthly Mass Tort LMI provides you with relevant, timely data, as well as our team analysis to support your mass tort campaign. We provide an overview of the legal landscape, as well as specific data and analysis for each tort.
(Data examples included below are not from current LMI. Please complete the form below to receive the most current edition.)
Overview of Mass Tort Media Landscape
Comparative Analysis
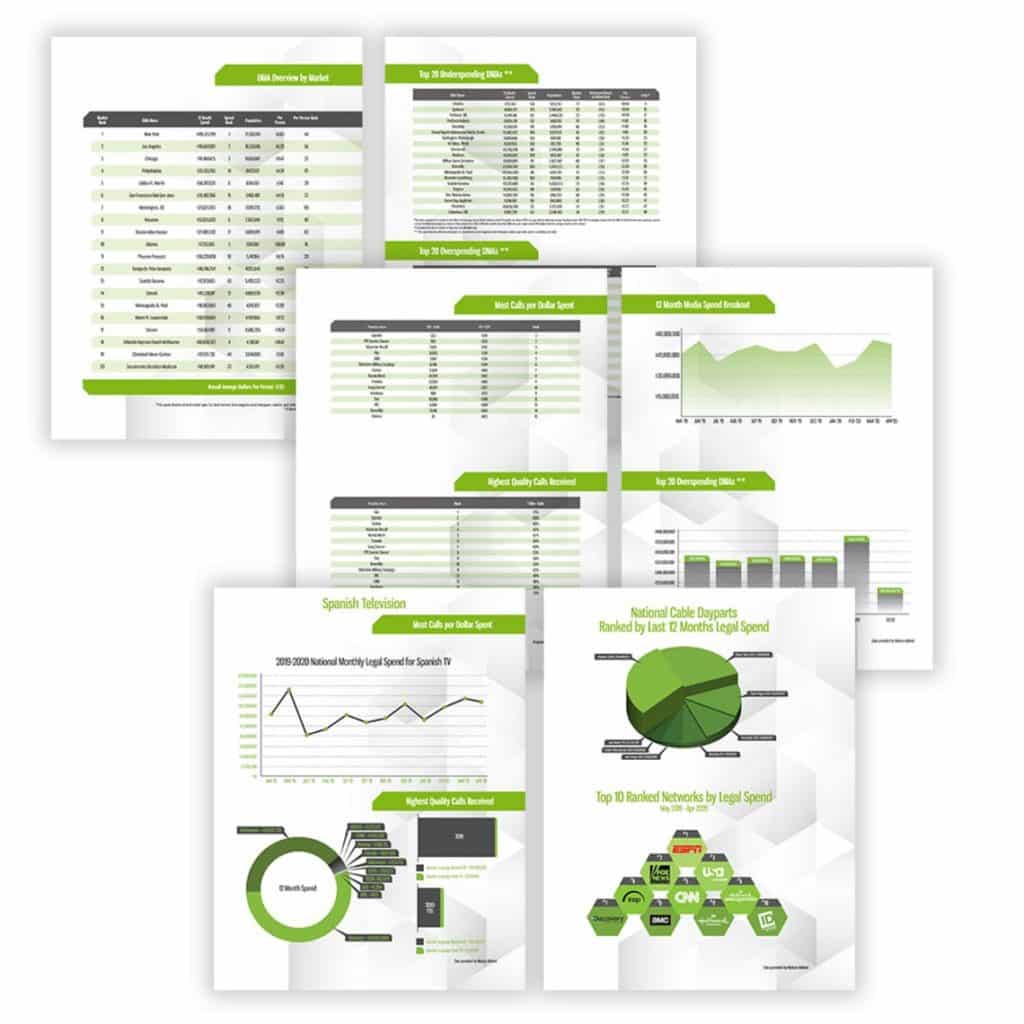
The Mass Tort LMI shows an overview of the media landscape that can be used for a comparative analysis of Designated Market Areas (DMAs), as well as specific mass torts. This data provides law firms with details about the overall national market.
We provide an overview each month of spending increases and decreases per tort, as well as the conversion rate of calls to qualified leads by practice area. We show additional call data, including Most Calls per Dollar Spent and Highest Quality Calls.
This information is valuable when doing a comparative analysis of torts. Our call center data provides us with unique insight.
The LMI also provides detailed data on media spend, including a 12-month overview of spending to show patterns in media spending in the overall market and the Spanish Television market. The spending data details the breakdown of all media spend, including print, radio, and out-of-home/outdoor. A breakdown of dayparts for national cable and top networks are also included.
Additional data for Spanish Television covers the Breakdown in Spanish TV networks and Spanish Network vs. TV.
All of this data can be used for a comparative analysis and general status of the market.
Data & Analysis by Tort
The Mass Tort LMI also includes detailed data and analysis broken down by tort. Information is culled from media industry monitoring data. Our team provides insight and analysis into our demographic targeting, including media consumption behaviors.
CAMG has unique access to data from our call center and medical records division, which we also include in the monthly LMI. This specific, current information for each tort can be applied to make data-based marketing decisions.
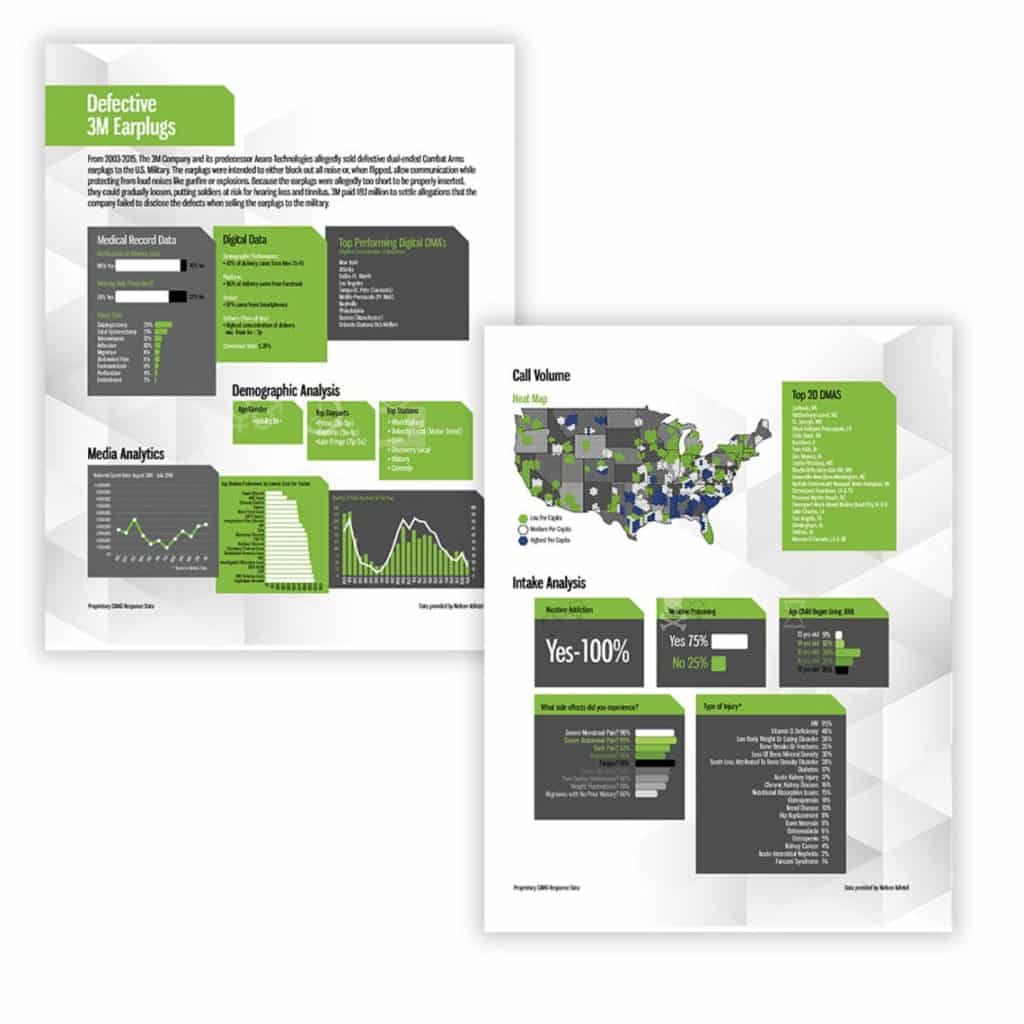
Medical Record Data
Med Record data shows a breakdown of information including manufacturers, verification of device implant or medication use and injury, as well as other valuable information available to CAMG through our Med Record division, CARS .
Demographic Analysis
For each tort, we provide a snapshot of our demographic analysis, including a breakdown of age/gender, as well as media consumption, such as top dayparts and programs.
Intake Analysis
Our call center (CATS ) provides us with intake analysis data that may include information about complications, age at time of diagnosis, manufacturer, and other details.
Media Analytics
Our team continuously analyzes media performance, providing information about top station performers (as shown by lowest cost per packet), quality of calls compared by hour of day, and a look at changes in national spend data for the tort.
This information provides valuable insight into where and when to run advertising.
CAMG Exclusive Heat Map
Our LMI analysis includes our exclusive heat map, which compares media markets by response on a per capita basis, rather than by sheer volume. Our heat map shows the “hot spots” across the country based on call volume per capita (per person).
Designated Market Areas are geographic areas designated by Nielsen to measure local TV viewing. There are 210 DMAs in the U.S.
DMAs with the highest call volume per capita may present good opportunities to run a campaign in a particular market. Heat maps are unique to each practice area.
Analyzing DMAs on a per capita basis shows us which DMAs are producing the most calls per person on a singular level, indicating the potential in smaller markets.
Digital Data and Analysis
As a full-spectrum agency, we also have access to detailed digital performance data. We have the ability to track by gender and age, social media platform and device, and delivery time of day, all of which we can take into consideration in planning digital campaigns.
In addition, we include a breakdown of the top performing digital DMAs by highest concentration of response for the particular practice area.
Access to the level of data and analysis presented in the monthly Mass Tort LMI can make an impact on your marketing. Complete the form below to receive the latest LMI or speak with your Sales Rep.
Single Event LMI, Media Spending & Marketing Trends
The monthly Single Event LMI provides attorneys with an overview of pertinent data about media spending and marketing trends, as well as data and analysis focused on specific practice areas.
Practice Areas Include:
- Auto Accident/Personal Injury
- Bankruptcy
- Business Interruption
- Family Law
- Medical Malpractice
- Nursing Home, Elder Abuse, and Neglect
- Sex Abuse
- Social Security/Disability
- Trucking
- Workers Compensation
(Data examples included below are not from current LMI. Please complete the form below to receive the most current edition.)
Overall Single Event Data
The Single Event LMI includes overall data about single event practice areas that can be used for a comparative analysis of practice areas and markets. Data includes spending broken down by practice area, as well as by Designated Market Area (DMA).
Index of Spending by DMA
This index and rank compare media spending of the DMA to the average rate of all markets in the last 12 months. An index of 100 is on par with the national average. Indexes above the baseline of 100 refer to above average per capita spending. Indexes below the baseline refer to markets with below average spending.
Additional information mirrors the Mass Tort LMI for legal spending trends, cable, network, and Spanish television.
Data Per Practice Area
The Single Event LMI also includes data and analysis broken down by practice area, based on CAMG proprietary campaign data and information from media industry monitoring sources.
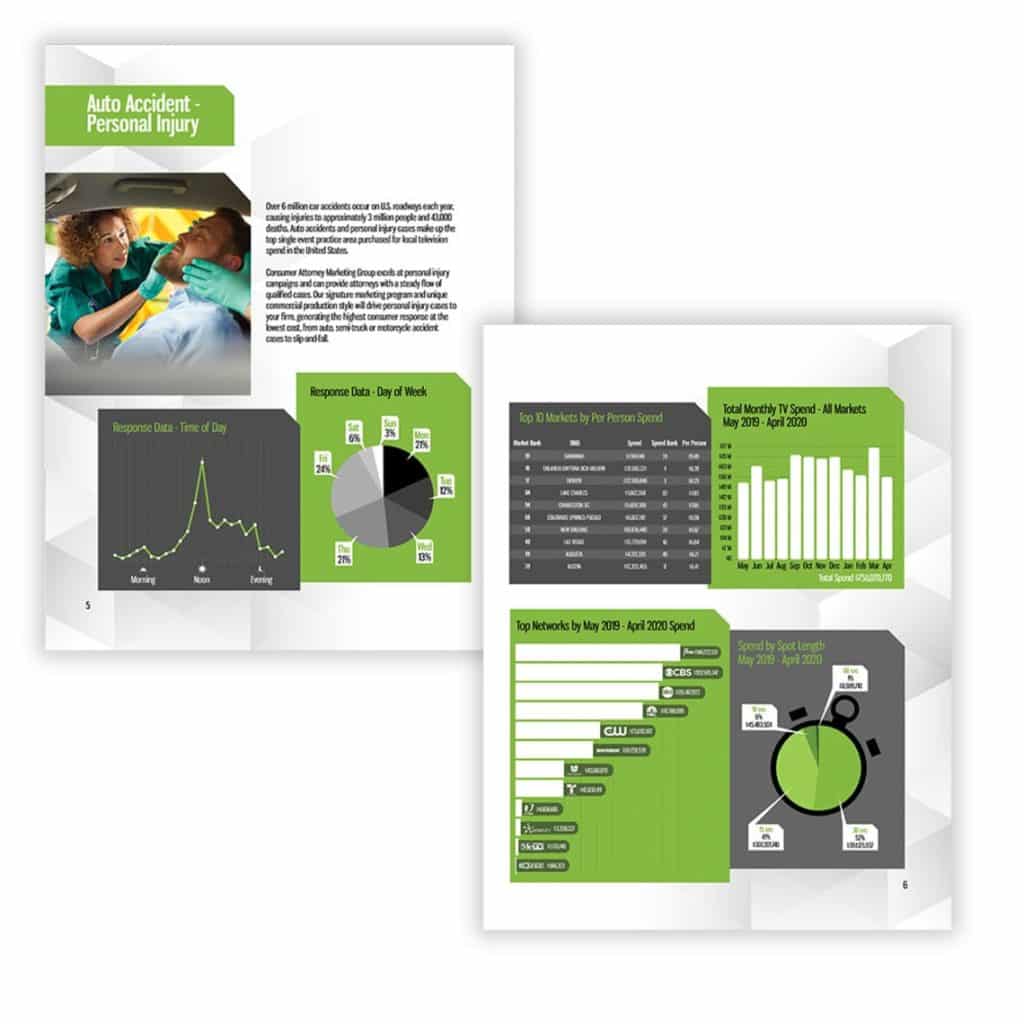
Top 10 Markets by Per Person Spend
Using this data, we can see which markets have the highest legal spend per person in the specific practice area. We can also compare each DMA’s legal spend for that particular practice area to the DMA’s population. The top 10 markets are listed in order of highest spend per person to lowest, which shows us which markets are spending the most on marketing on a per capita basis.
The adjacent chart shows us total monthly TV spend trends across all markets.
Response Data
Because we track each campaign, we can share response data by time of day and day of week, which helps us make marketing decisions.
Top Spend by Networks and Spot Length
Additional information in the Single Event LMI per practice area includes the legal spend by network over the past 12 months, as reported by Nielsen Adintel. We also break down spending by spot length.
Complete the form below or speak to your Sales Rep to receive the current Single Event LMI. From access to legal spending trends by market, practice area, or overall to detailed demographic targeting and response data and analysis, both the Mass Tort and Single Event Legal Market Index provide you with an unparalleled and comprehensive compilation of data and analysis you can use to make intelligent marketing decisions.

Is your firm in the Top 3 of Google Search?
About CAMG
Are you looking for data-driven marketing for your law firm?
Steve and his team are as honest as the day is long. No question on ethics & transparency.

Monthly data publications keep us current with industry best practices

CAMG is the best in the business when it comes to pricing and ethical sourcing of mass torts leads, bar none!

THE NATION’S LARGEST FULLY INTEGRATED
Marketing Agency Dedicated to Law Firms
- Television
- Radio
- Public Relations
- Medical Record Retrieval & Review
- Search Engine Optimization
- Paid Digital
- Out of Home
- Intake & Contracting Services